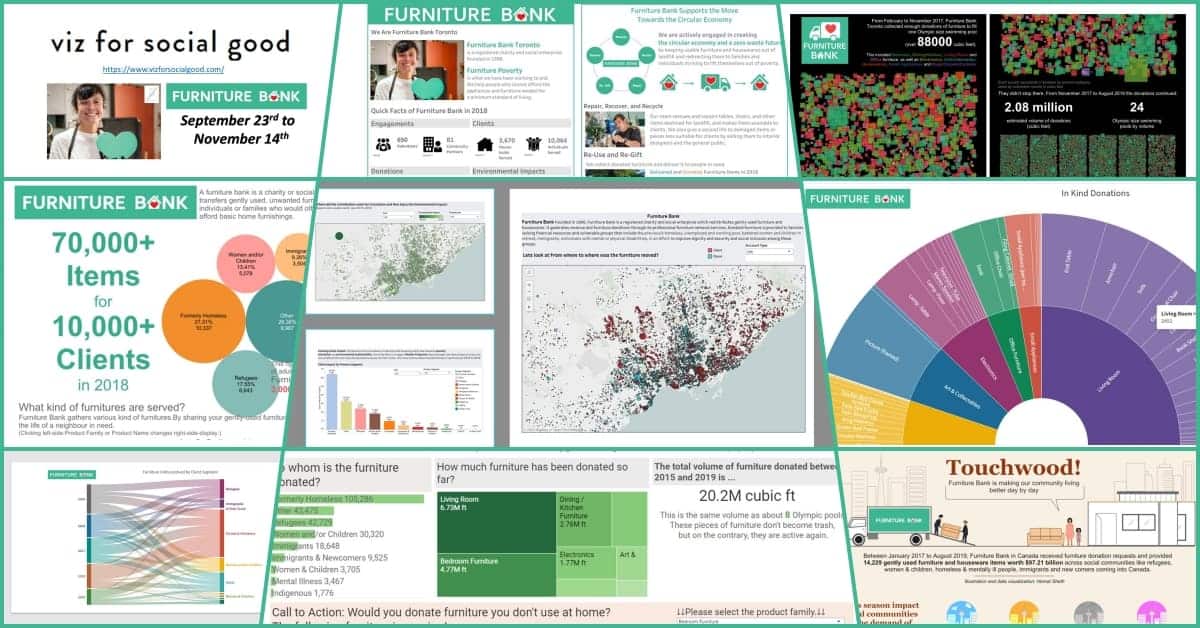
The last 45 days the amazing volunteers of VIZ FOR SOCIAL GOOD worked with our impact datasets to tell stories about Furniture Bank.
Designers from Japan, India, USA, UK, Singapore, Ireland, and of course Canada created 19 different data visualizations with Tableau, Flourish and Kaggle!
Each telling the furniture for good story that occurs here in the Greater Toronto Area.
Amazing to see the creativity that comes from the same data!
Thank you all for stress testing our data and inspiring donors to fund the work we do.
We’ve created a post here with has links to all the work but we’ve included photos too so their design can be maintained for the future.
- Visualization by Yoshitaka Arakawa
- Visualization by Hemal Seth
- Visualization by Will Luna
- Visualization by Jasleen Kaur
- Visualization by Neil Richards (and Project Supporter)
- Visualization by Hui Xiang Chua
- Visualization by Louise Shorten
- Visualization by Meghashree Kaishetty
- Visualization by Aquinov “Akky” Mathappan
- Visualization by Satoshi Ganeko
- Visualization by Kamegaki Hiroyoshi
- Visualization by Samantha Gonsalves
- Visualization by Yasushi Ishikawa
- Visualization by A Sumi
- Visualization by hmyzk_dataviz
- Visualization by Hironobu Yoshida
- Visualization by Michiko S
- Visualization by Vanitha Lucas (And Project Lead)
Big thank you from all at Furniture Bank!